
Krantz Family Center for Cancer Research
Pinello Lab
Pinello Laboratory
Explore the Pinello Lab
2024 Krantz Awards Recipient
2024 Spark Award: Generative AI models for deciphering cancer regulatory logic and targeted therapeutic applications
Luca Pinello, PhD

Research Summary
The focus of the Pinello laboratory is to use innovative computational approaches and cutting-edge experimental assays, such as CRISPR genome editing and single-cell sequencing, to systematically analyze sources of genetic and epigenetic variation and gene expression variability that underlie human traits and diseases. The lab uses generative AI, machine learning, and high-performance computing technologies to solve computationally challenging and Big Data problems associated with gene regulation, functional genomics, and sequencing data analysis. Our mission is to use computational strategies to further our understanding of disease etiology and to provide a foundation for the development of new drugs and novel targeted treatments.
Research Projects
The Pinello laboratory is at the forefront of computational biology, focusing on deciphering the role of chromatin structure, dynamics, and non-coding regions in gene regulation. Our mission is to integrate multiomics data to explore and better understand the functional mechanisms of the genome and to provide accessible tools for the scientific community to accelerate discovery in this field.
We have made significant contributions to the genome editing field, developing computational tools like CRISPResso, which has become the standard for quantifying and visualizing CRISPR editing outcomes. Our work on the BCL11A enhancer led to the development of clinical trials for sickle cell disease and β-thalassemia, and ultimately contributed to the first FDAapproved CRISPR-based drug, Casgevy. Recently, we developed CRISPRme, a tool that considers genetic variants to provide a more comprehensive assessment of offtarget risks in CRISPR-based therapies. This work uncovered unappreciated off-targets for therapeutic guides based on genetic diversity, with immediate implications for ongoing clinical trials in diseases ranging from blood disorders to cancer.
In the field of single-cell genomics, we have developed methods like STREAM for trajectory inference from transcriptomic and epigenomic data, SIMBA for clustering-free marker discovery and omics data integration, and Dictys for recovering dynamic regulatory networks from single-cell multiomics data. These tools are enabling deeper insights into cellular heterogeneity, developmental processes, and gene regulatory dynamics across various biological contexts.
Our lab is also leading one of the characterization centers of the NHGRI Impact of Genomic Variation on Function (IGVF) Consortium. Here, we are combining CRISPR genome editing, single-cell assays, and novel computational tools to characterize the impact of genetic variants on different phenotypes at scale. This work has already led to significant advancements in variant classification and effect size quantification, particularly in the context of cardiovascular diseases. Our recent publication in Nature Genetics (Ryu et al., 2024) introduces BEAN, a Bayesian network that integrates genotypic and phenotypic data from base editing screens. This innovative approach significantly improves the accuracy of variant effect predictions, outperforming existing methods in classifying pathogenic variants and quantifying their effect sizes. By applying BEAN to high-throughput base editing screens, we have successfully identified common variants affecting LDL uptake and novel genes associated with this process. Moreover, our saturation base editing of LDLR accurately predicted the effects of missense variants on LDL-C levels, aligning with measurements from UK Biobank individuals. This work not only enhances our ability to characterize disease-associated variants but also presents a robust methodology for improving the efficacy of base editor screens in functional genomics research.
Looking ahead, we are excited to explore cutting-edge spatial profiling technologies and harness the power of generative AI for therapeutic DNA sequence synthesis. These new directions hold tremendous potential for advancing our understanding of tissue structures in various diseases and for synthesizing novel DNA regulatory sequences to control gene expression. Our recent work on DNA-Diffusion exemplifies this approach, leveraging generative models to design synthetic regulatory elements that can control chromatin accessibility and gene expression. This innovative method allows us to explore and potentially manipulate the fundamental rules governing gene regulation, opening new avenues for therapeutic interventions and synthetic biology applications.
Our ultimate goal is to further our understanding of disease etiology involving poorly characterized genomic regions and to provide a foundation for the development of new drugs and more targeted treatments. By leveraging state-of-the-art computational approaches and experimental assays, we aim to systematically analyze sources of genetic and epigenetic variation that affect gene regulation in different human traits and diseases.
Publications
Selected Publications
DaSilva LF, et al. DNA-Diffusion: Leveraging Generative Models for Controlling Chromatin Accessibility and Gene Expression via Synthetic Regulatory Elements. bioRxiv [Preprint]. 2024 Feb 1:2024.02.01.578352.
Ryu J, Barkal S, Yu T, et al. Joint genotypic and phenotypic outcome modeling improves base editing variant effect quantification. Nat Genet. 2024 May;56(5):925-937.
Chen H, et al. SIMBA: single-cell embedding along with features. Nat Methods. 2023 May 29.
Wang L, et al. Dictys: dynamic gene regulatory network dissects developmental continuum with single-cell multiomics. Nat Methods. 2023 Sep;20(9):1368-1378.
Cancellieri S, et al. Human genetic diversity alters off-target outcomes of therapeutic gene editing. Nat Genet. 2023 Jan;55(1):34-43.
Wei Y, et al. Single-cell analysis and functional characterization uncover the stem cell hierarchies and developmental origins of rhabdomyosarcoma. Nat Cancer. 2022 Aug;3(8):961-975.
Research Image
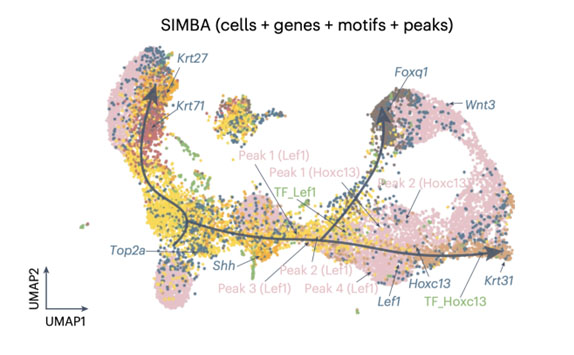 SIMBA (Single-cell embedding along with features) co-embedding of cells and multi-omic features reveals regulatory circuits and master regulators in mouse hair follicle differentiation. The visualization shows cells, top-ranked genes, TF motifs, and associated chromatin accessibility peaks in a shared embedding space. Key regulators like Lef1 and Hoxc13 are positioned along the differentiation trajectory, with their associated genes and regulatory elements clustered nearby. This co-embedding approach enables the identification of cell type-specific features, master regulators, and potential target genes, providing insights into the gene regulatory dynamics during cellular differentiation. Photo credit: Adapted from Chen et al., Nature Methods, 2023.
Our Researchers
Luca Pinello, PhD
Principal InvestigatorGroup Members
- Alexander Aibazides, PhD
- Basheer Becerra*
- Logan Blaine*
- Eric Che
- Lucas Ferreira Da Silva, PhD
- Justin Delano*
- Junxi Feng
- Gue-Ho Hwang, PhD
- Zhijian Li, PhD
- Jiachen Li†
- Zain Patel, PhD
- Jayoung Ryu*
- Vivien Schoonenberg, PhD
- Simon Senan
- Jiang Sizhu
- Cameron Smith, MD, PhD
- Benjamin Vyshedskiy
*PhD student
† Visiting PhD student